Node-RED Dashboard Presentation
A platform to manage easily your end devices and monitoring your system.
Introduction
In this part we will discuss these topics:
From this link you can download the libraries installation guide (.pdf),
here.
Also, if you did not fully understand some parts of this paragraph or you want to learn more, you can watch this video:
Description about our Gateway and its shield to receive the data
Gateway
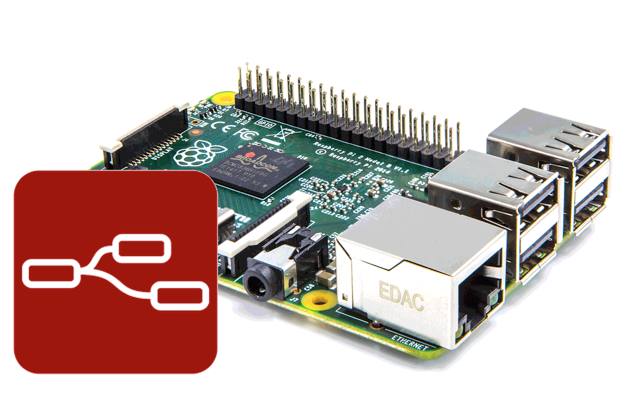
To receive the information’s from the device node we used a Raspberry Pi 3B+ (RPi3), because is so smart for many applications, low power consumption, you can interface on it in several ways, configurable as you can want and 40 GPIO PIN to put the shield that you want, and but not less important, is very small, and is usable also for the users that are not practical with CLI commands.
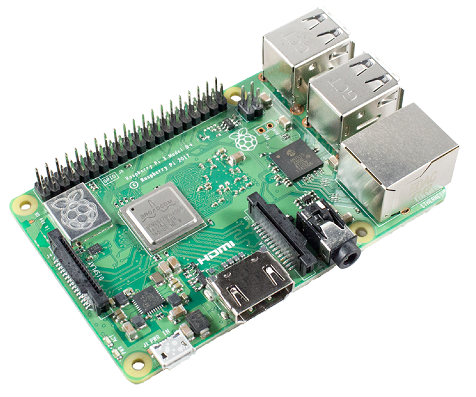
Raspberry Pi 3B+
Shield for LoraWAN Application
Our choice about the shield for the RPi3 is fell on IoT LoRa Node pHAT for Raspberry Pi that used a RAK811 LoRa Module based on SX1276, because can manage a very high number of nodes, has low consumption (50mA in transmission) and high range coverage (up to 10km).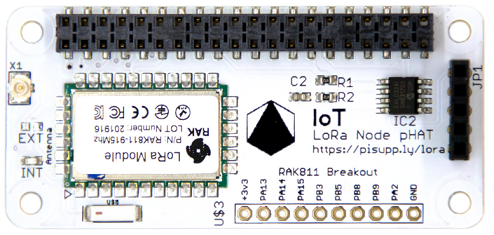
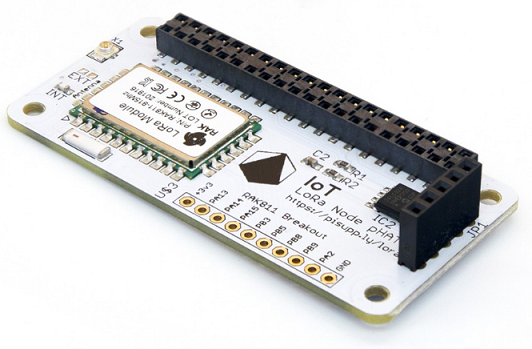
pHAT
By default, this shield is not thought to use as gateway, the basic configuration is to send the data, but our goal for this project is to reduce the costs, and the gateway shield has a significant cost (~150€, against 30€ for our module), so we configured the pHAT module as gateway. It has 2 antennas, one internal, used by default, and one external to improve the transmission's range. In our beta test for the firsts data transmission, we used the internal antenna because is smart, but in the end of final tests, we used the external antenna for improve the data range, to use it we de-solder the inductor from on the INT solder pads and put it on the EXT solder pads.
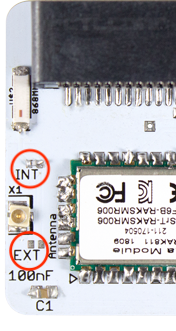
pHAT INT/EXT Solder pads
From the Official Pi-Supply repository on GitHub you can find additional informations and software.
Node-RED Introduction
What’s Node-RED?
Node-RED, based on JavaScript, is a graphical object programming platform to perform different type of projects.
One of the major features is to programming using the nodes,
link to each other to obtain the result,
and every node can contain a little script or information to manipulate the input message,
this feature allows to the people who are unfamiliar with coding, to create their own project very quickly.
Another feature of Node-RED it can be installed in different type of devices, for example on Raspberry Pi, your PC, etc.
Also, you can secure it using a password, to do that you need to modify settings.js (hidden) file, for more details:
Securing Node-RED.
For more details about Node-RED watch on the
Node-RED official website or watch on our Regarding Security tab.
Node-RED Control Panel
In this part we describe from the Node-RED Control Panel the main flow, where the script will launch and data’s management, so let’s start.
How it works
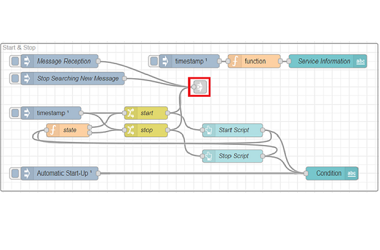
At Start&Stop (Figure 1) nodes group you can manually start (Message Reception) or stop the script (Stop Searching New Message),
or you can use the button on the Home Tab.
The connection with the next group is done with the link highlighted in red.
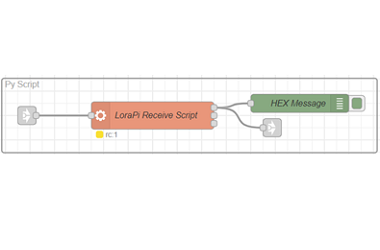
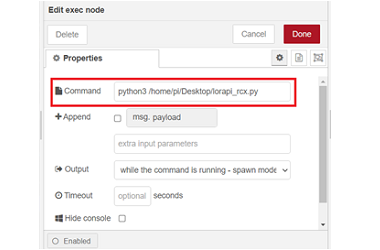
In the following group (Figure 2) arrives the input on LoraPi Receive Script node and it launch (break) the .py script (is on our GitHub Repository) with the command previously set (Figure 3) and return that the gateway will receives from the LoRa Nodes, as you can see in the next screens.
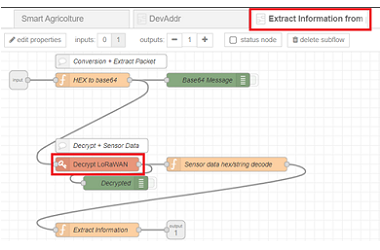
About the Extrapolation group, we will focus on Extract Information from payload and DevAddr subgroups (Figure 4).
A focus is on Decrypt LoraWAN, where you need to put your personal Network Secret Key and Application Secret Key.
On the first one, we have all the conversion and manipulation part of the payload that our gateway receives.
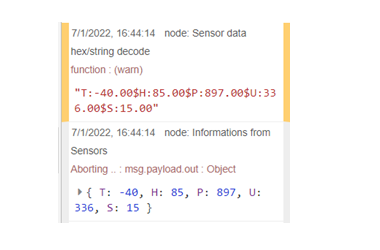
The Sensor data hex/string decode will return the original message with $ separator,
and the last node create a dictionary with all the values, and example is at Figure 5,
where the values are generated from our test board.
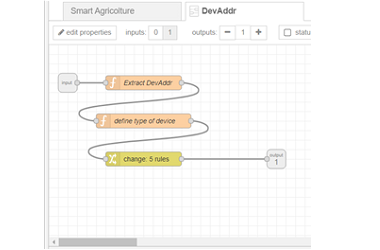
At this point, we have obtained the original message, and the DevAddr (Figure 6), but is not in string format as we need, so to convert it we used the second one subgroup, and it done other secondaries activities, for example you can add additional information to better identify the board on the Dashboard.
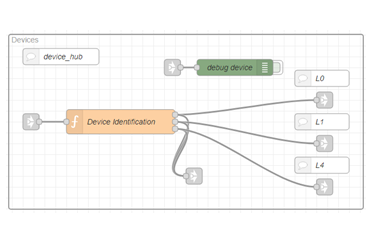
At the end of all of this, there’s the last fundamental group (Devices) that from the DevAddr identify redirect to the proper flow, as you can see in the last figure, Figure 7.
Smart-Agriculture Dashboard Presentation
Here we describe the GUI of our Dashboard.
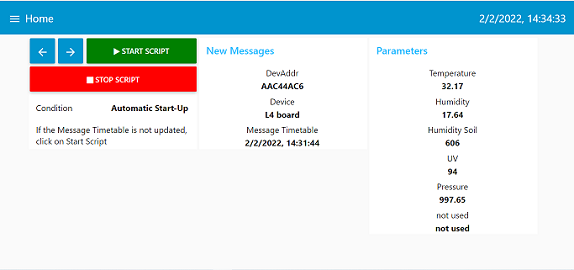
Home
Here you can visualize all the main information from your module, as the DevAddr, and the data that it transmit, and also you can manage the script with two buttons and visualize the situation of it. With the two arrows on the left you can move from the previos tab (left) or the next tab (right).
Devices
Here you can visualize all the devices that you have configured previously.
In this case, our modules use the same sensors, if you click on one of them,
you have multiple buttons to change the visualization of the chart and gauge,
for example by default we set the temperature, so you have the chart and gauge
of the temperature, but if you change your choice, these two will update with the
new choice, under of them there's the chart with all the parameters.
All the values that you can see on this charts and on the gauge are ON LIVE,
so don't worry, this information are stored on a csv file.
Remeber: to add/remove device you need to modify the flow from the control panel.
Charts
In this tab you can visualize all the chart's parameters ON LIVE for all your devices,
this information will be saved on a csv file, that you can watch in an appropriate tab.
With the buttons as you can see on the animated gif you can visualize/hide them one by one.
Remeber: to add/remove parameters you need to modify the flow from the control panel.
RPi Control
Here you can manage the gateway, visualize the main parameters,
and reboot or shutdown it remotly, for these two there's a "security button" to not click them without waiting to.
File Manager
Here you can manage the log files that your devices generates, you can download it on your desktop or delete them. About the log files, the format is:
timestamp,temperature,pressure,humidity,humidity soil,uval you can see here, all the values are separated by a comma.
The timestamp is taken from the gateway, in our case the RPi, so if you have problems with the datetime take a look on your RPi, because it hasn't a clock hardware like Notebook or PC Desktop, to take down the the clock it needs to connect at Network Time Protocl (NTP) server, but if for some reason the connection to this server will not work,your clock will be wrong.
File Visualizator
Also here you can simply visualize your log files as charts (at least 5),
if your module has less than 5 sensors the unused chart will be empty.
All our modules use the same sensors, but if you use a different sensor(s) go on
the appropriate device tab, there's a subgroup called "Auto Logger", here you need to change,
on the Set Data node, the payload and also, in the following node called csv, the name
of the related column(s).
Python Script Description
At the end of this paragraph, we will shortly describe our python script that we put on our gateway.
Initially we set:
response = lora.set_config('lora:work_mode:1')where for work_mode we set it for LoRaP2P communication, because we don't use the LoRaWAN network, and for transfer_mode we set it as receiver, because we use our module as gateway, how we describe in the previos lines.
for r in response:
print(r)
mode_text = lora.set_config('lorap2p:transfer_mode:1')
In this part we define the RF configuration parameters:
freq = 869.800Remeber to set the same frequency, spreading factor (sf) and bandwidth (bw) on all your devices, the other parameters are coding rate, preamble and transmission power respectively.
sf = 12
bw = 0 # 125KHz
ci = 3 # 4/7
pre = 8
pwr = 20
In this last block code, we are ready to receive our information's:
lora.set_config(f'lorap2p:{int(freq*1000*1000)}:{sf}:{bw}:{ci}:{pre}:{pwr}')We have observed in our first test, that if the packet is corrupt (too large distance or interference in the middle), the script crashes because it can't decode the message as UTF-8, so you need to restart the script from Node-RED platform, to solve this problem there's this line errors('ignore') to skip the corrupted message.
print('ok')
while True:
lora.receive_p2p(1000)
while lora.nb_downlinks > 0:
message = lora.get_downlink()
data = message['data'].decode('UTF-8').errors('ignore')
print(data)